TRAFFIX Trends Q2 2025
April 15, 2025
KEY MARKET INDICATORS
The US Tariffs will impact freight demand and drive rates in Q2
Tariffs and trade policy impacts will likely be a key influence on the 2025 freight market. There has been temporary relief to some tariff increases, but many remain in place (China, Steel, Aluminum, 10% baseline tariffs, and others). Increasing uncertainty in the market could lead to a recession and a freight demand slowdown.
Companies importing into the US are facing a difficult decision on whether to ramp up shipments in Q2 despite the current tariffs, or, alternatively, hold back shipments in hope of tariffs decreasing.
Overall freight rates are expected to be volatile, especially as deadlines for policy changes approach. Economic activity and consumer demand (freight demand) will determine the direction of freight rates.
Q1 saw slowing growth of transportation prices
and mixed signals for U.S. manufacturing
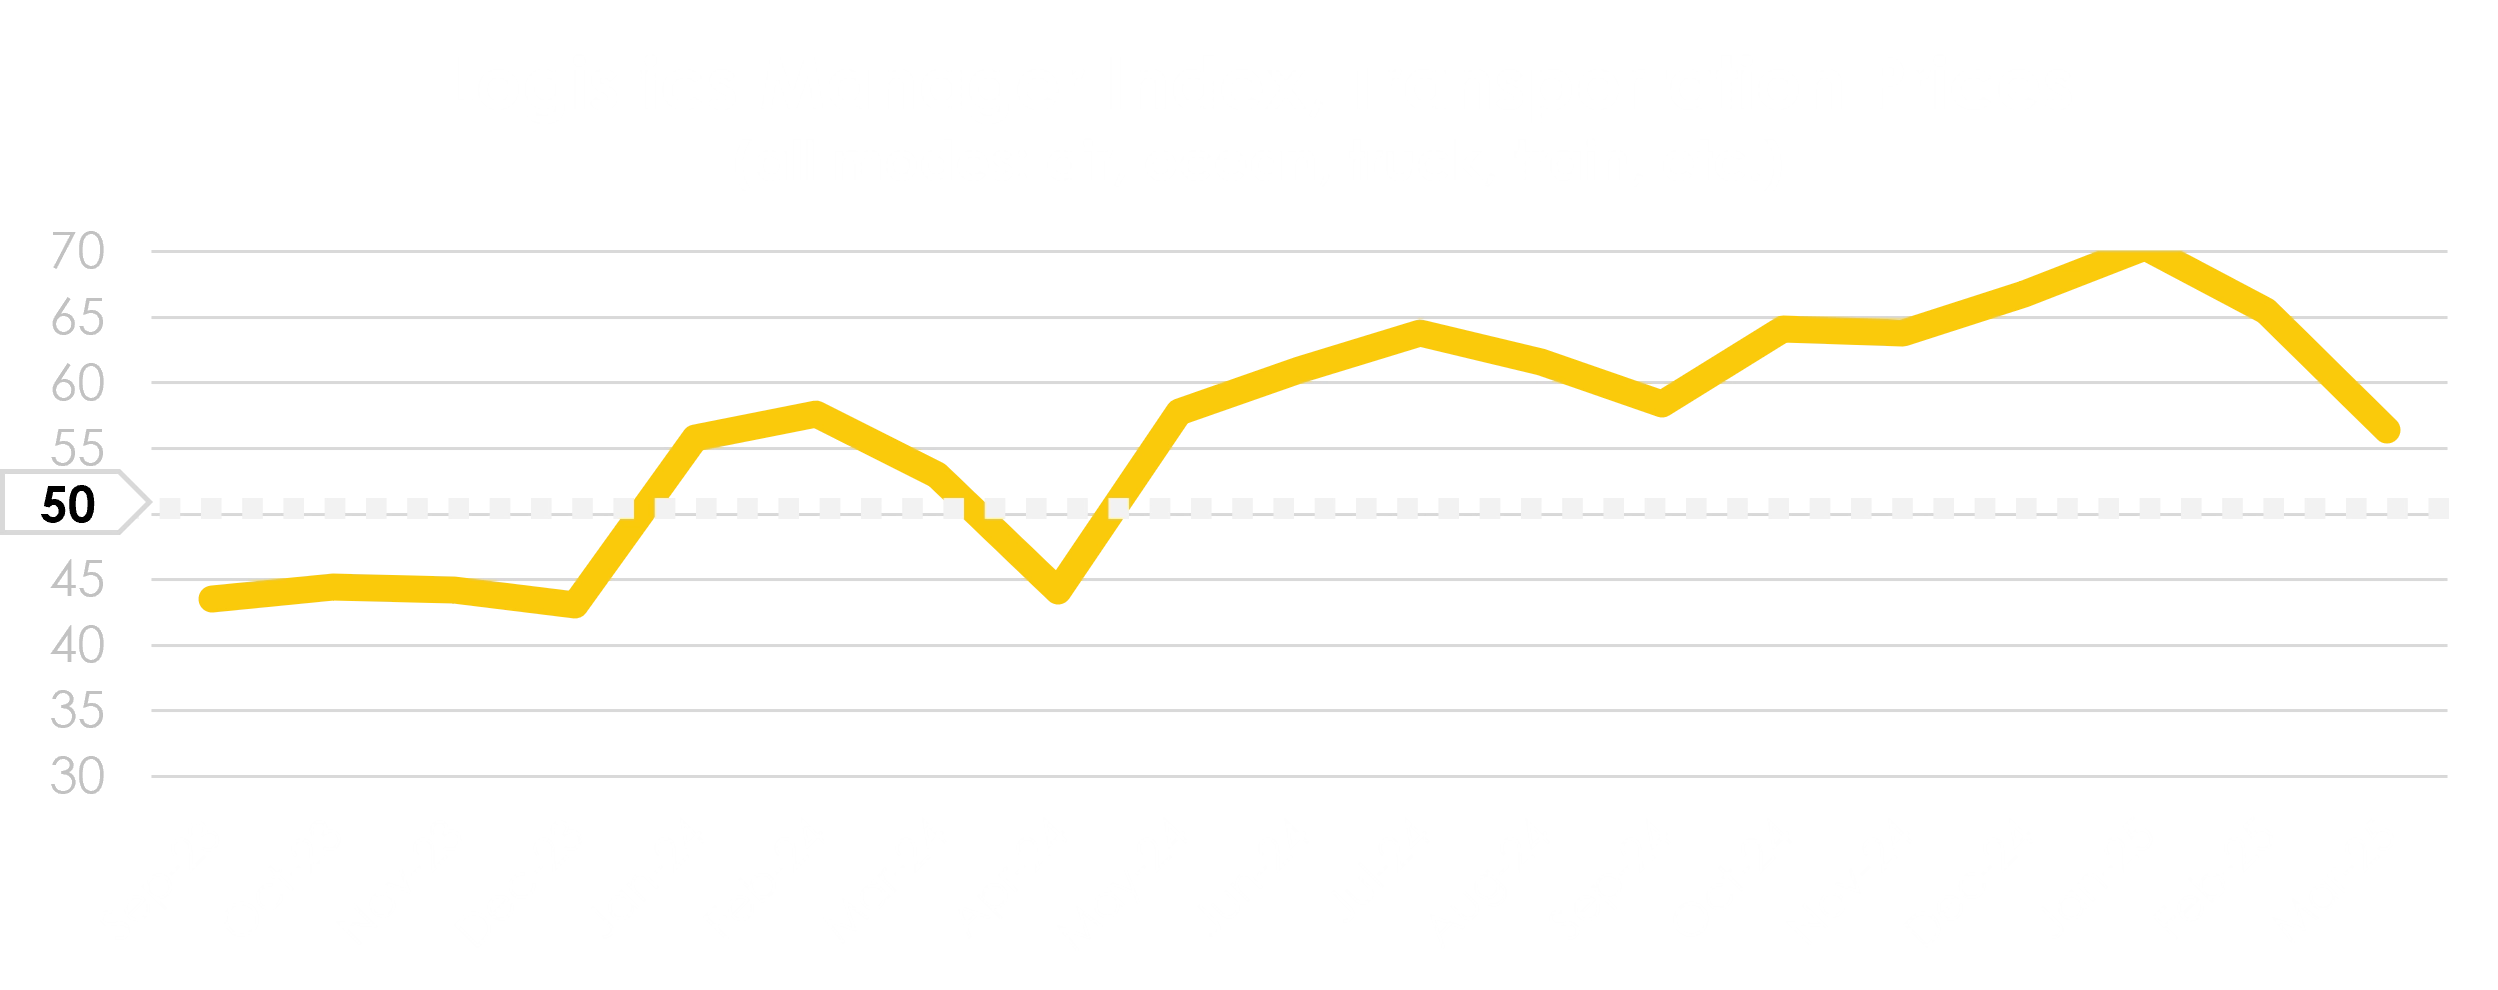
The Logistics Manager Index (LMI) of transportation prices has seen a swing from January’s high of 70 back down to 56 in March (where 50 is neutral). This indicates that transportation price increases are still present, but less than previously expected. Rate increases are still expected over the next 12 months, but rates are expected to rise less than before (March’s future expectations at 60, down from 77 in December).

Source: LMI
After nearly two years of manufacturing contraction, the Purchasing Manager’s Index (PMI) saw expansion in January and February. However, March’s reading of 49 (where 50 is neutral) indicates manufacturing returning to a state of contraction. This is likely influenced by the uncertainty surrounding tariffs with Mexico and Canada, with the broader global uncertainty hitting in April.

Source: PMI
U.S. TRUCKING MARKET
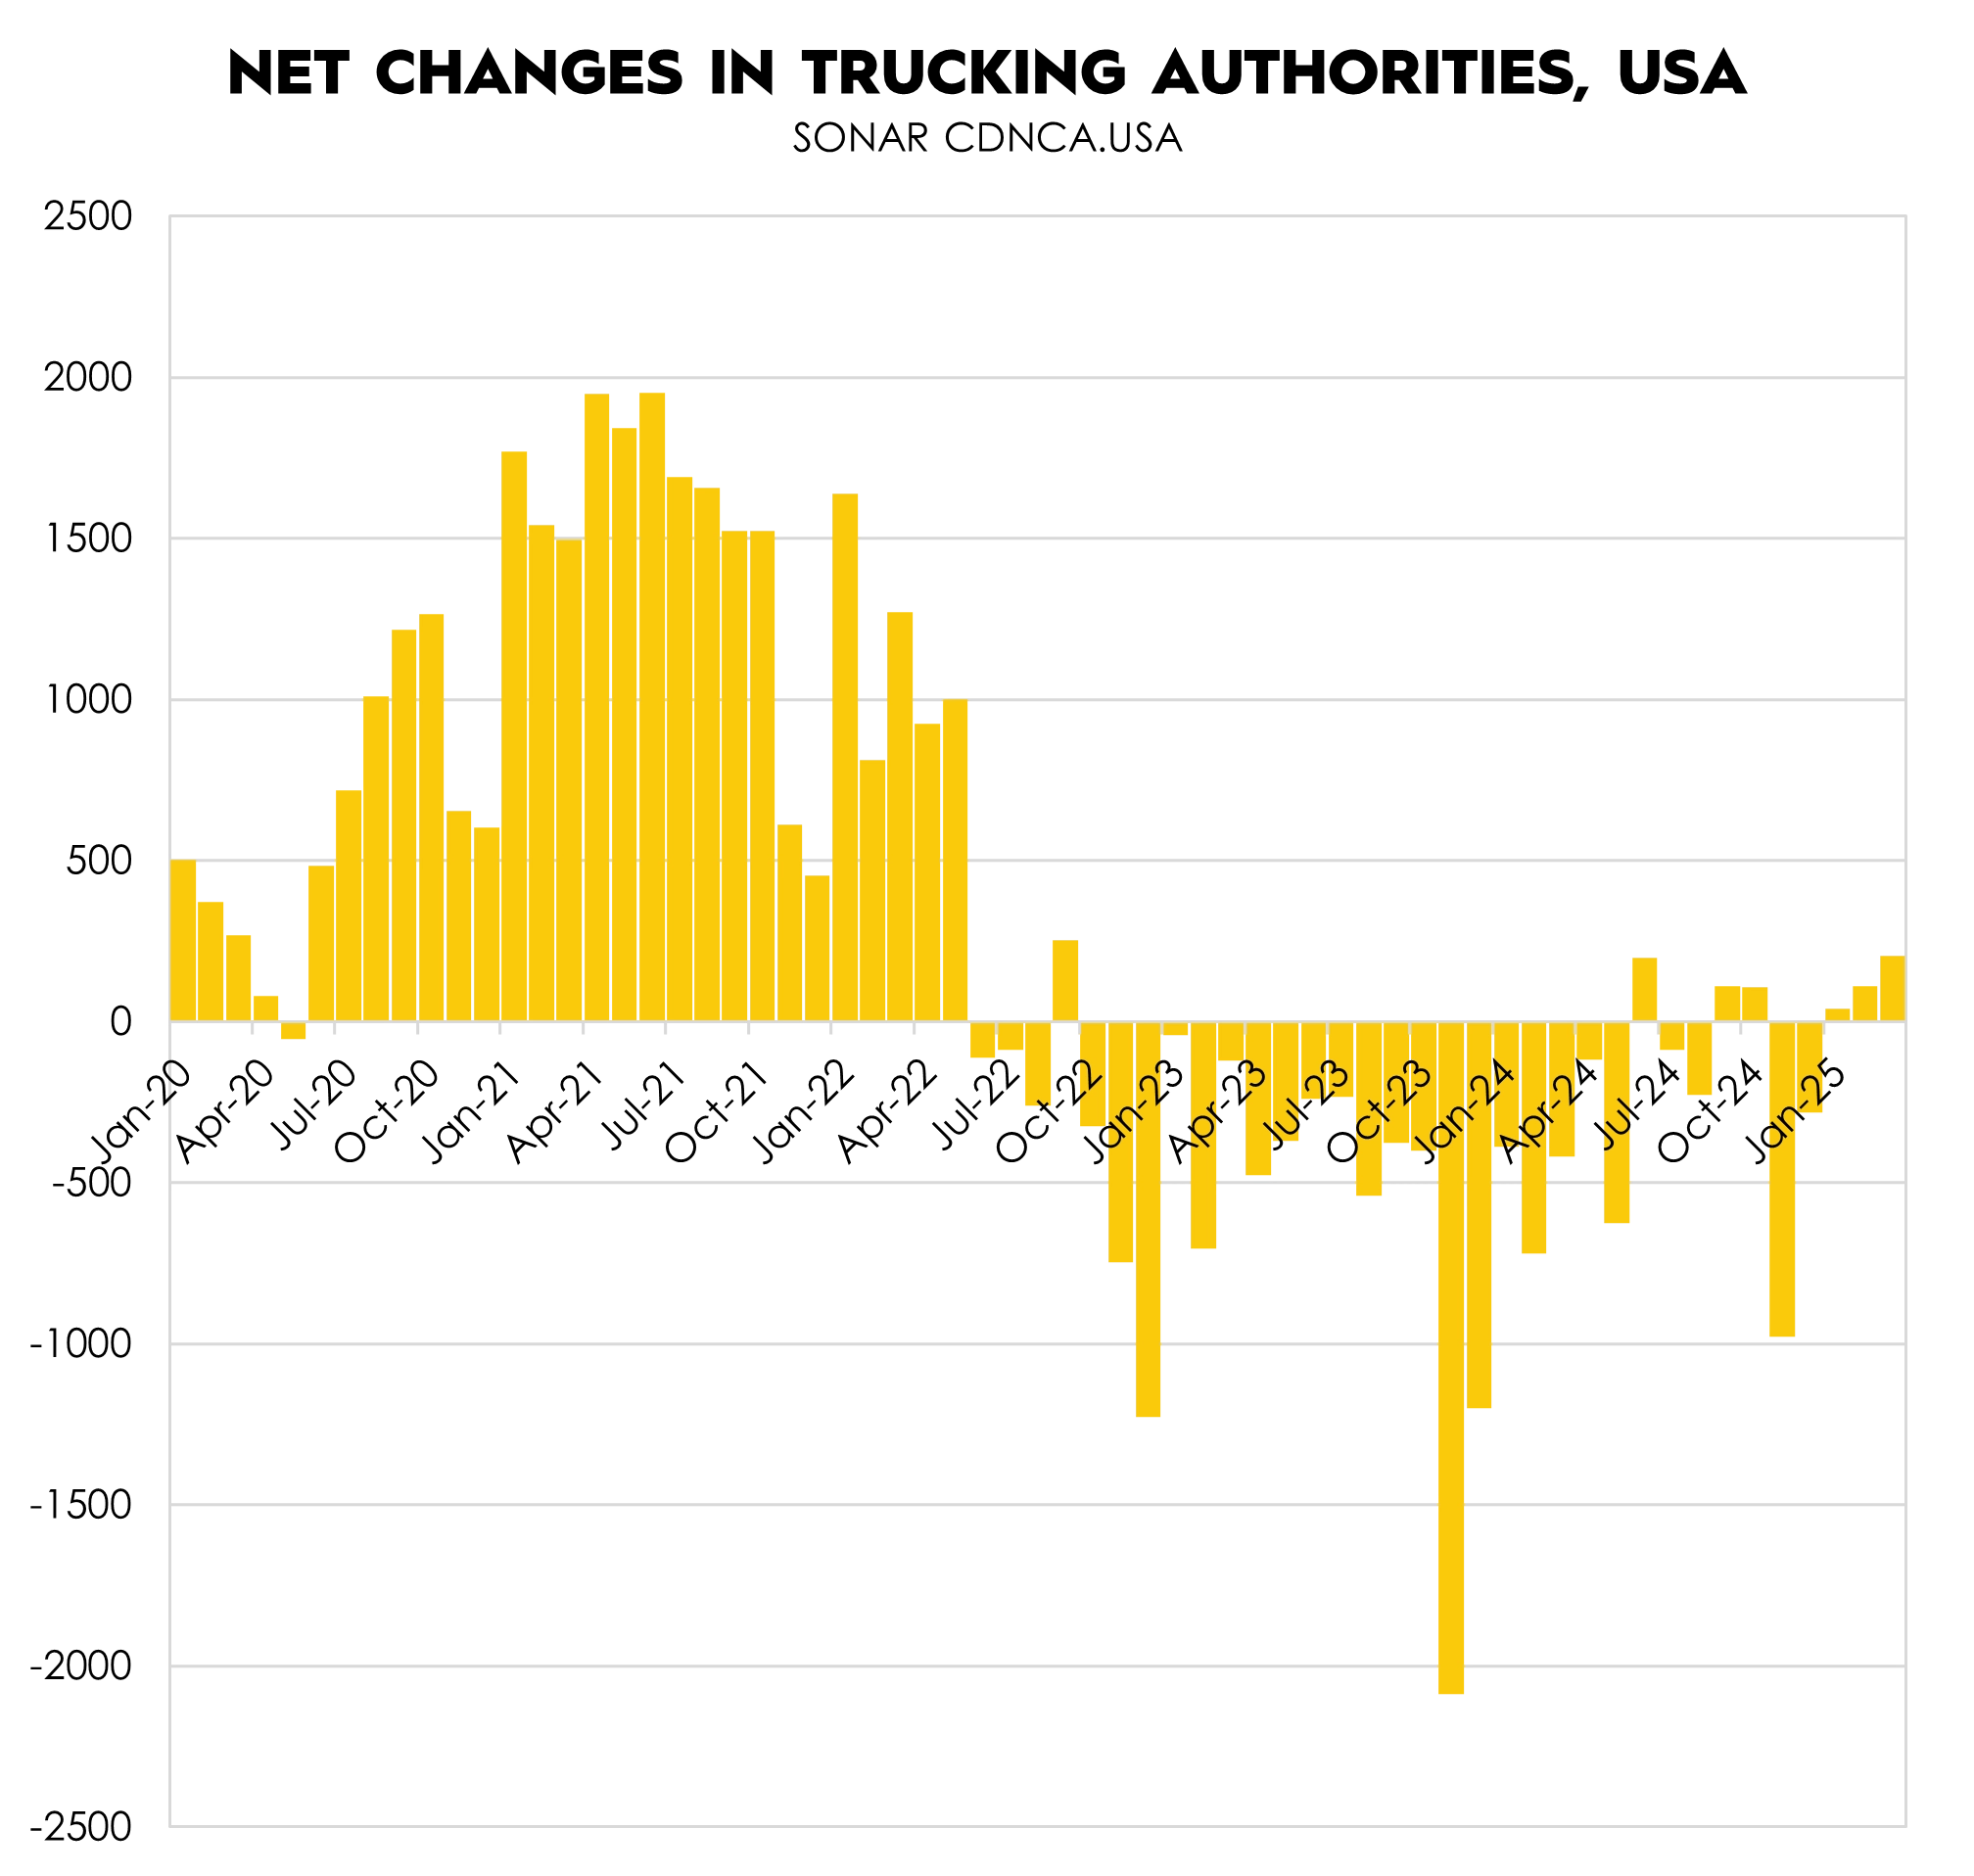
In recent years, the North American trucking market has experienced two major disruptions. The first was a demand surge driven by COVID-19, leading to skyrocketing demand for goods and elevated rates. This was followed by a supply influx, as high rates attracted new trucking companies into the market. As rates normalized and then declined, many trucking companies exited the market.
In Q1 2025, we again saw a growth in trucking authorities, averaging more than 100 new authorities added each month. This suggests that capacity decreases have reached a demand/supply equilibrium, and that supply has begun to re-enter the market. While capacity is returning (supply increase) the direction of freight volume (demand) will determine whether rates increase or decrease in 2025.

Source: FreightWaves SONAR – April 9, 2025
YoY freight rates are anticipated to be volatile,
dependent on overall freight demand
- Freight rates will be dependent on North American economic conditions and consumer demand, which will drive freight volume demand
- A recession and/or decrease in demand could lower volume and freight rates; alternatively, rates could remain steady or increase from freight volume growth
- Oil futures indicate a potential decrease in diesel rates, although volatility is expected
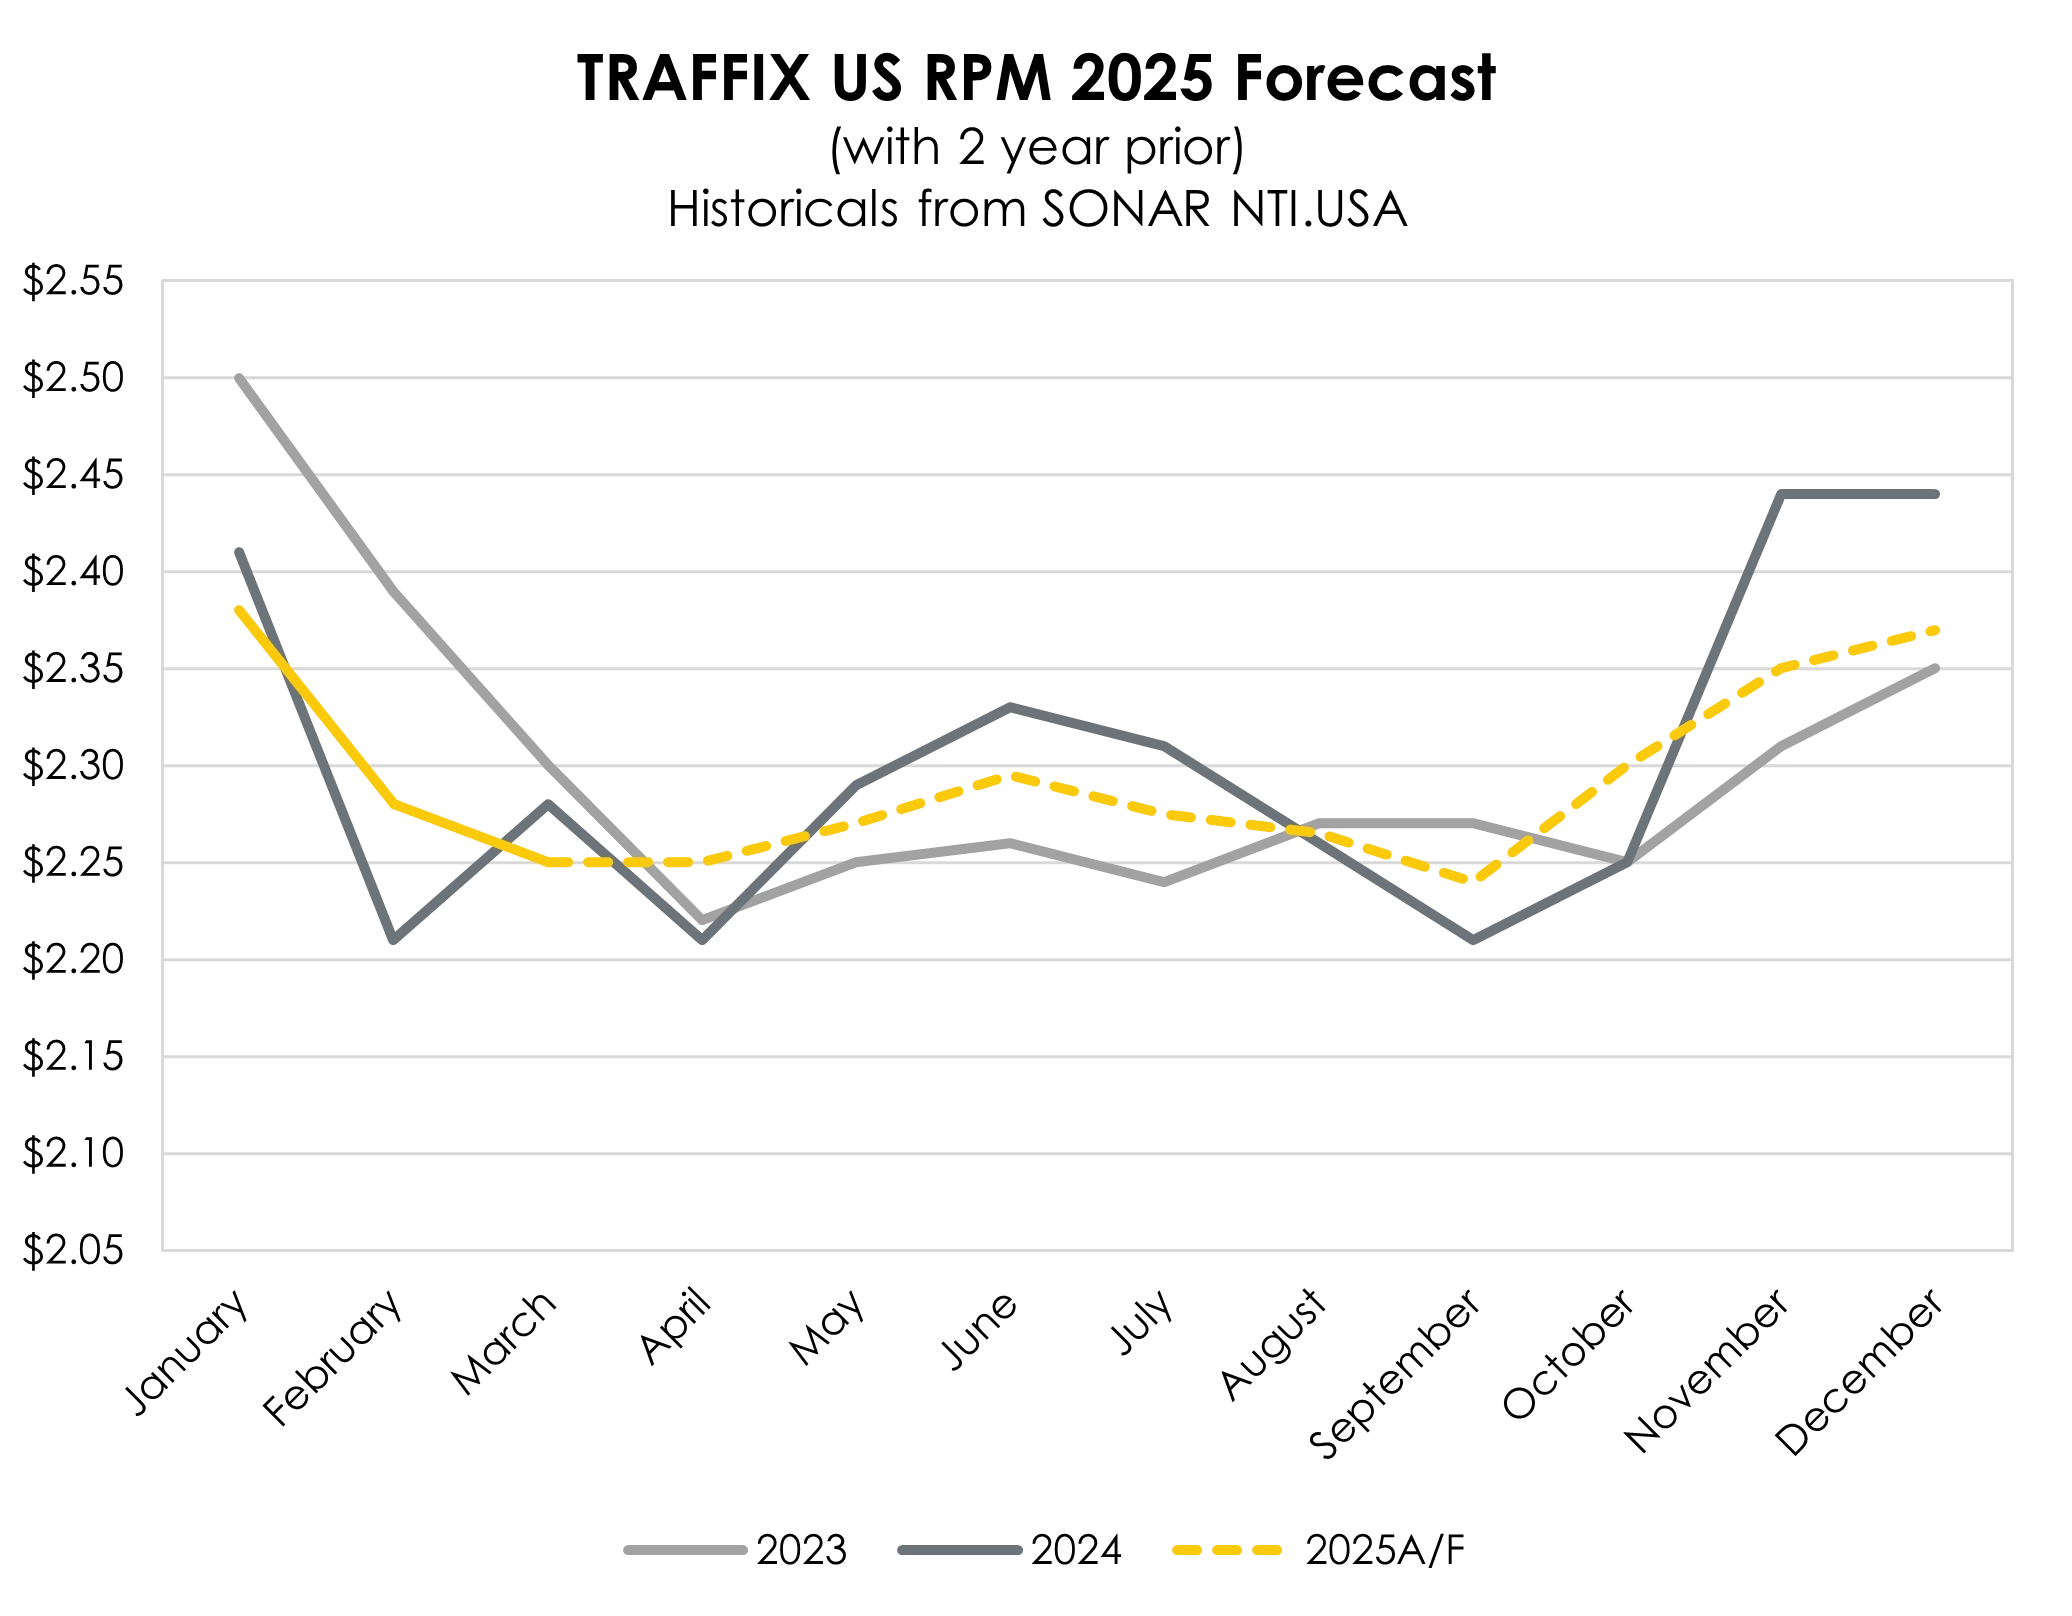
- The revised freight rate forecast projects average freight rates closer to 2024 rates, with volatility increasing, and market-specific transient jumps of +/- 10% or more
- Changing trade policies, especially for North American cross-border trade, will see temporary surges in demand in response to policy changes and deadlines

Source: FreightWaves SONAR – April 9, 2025
FREIGHT PRICING POWER INDEX
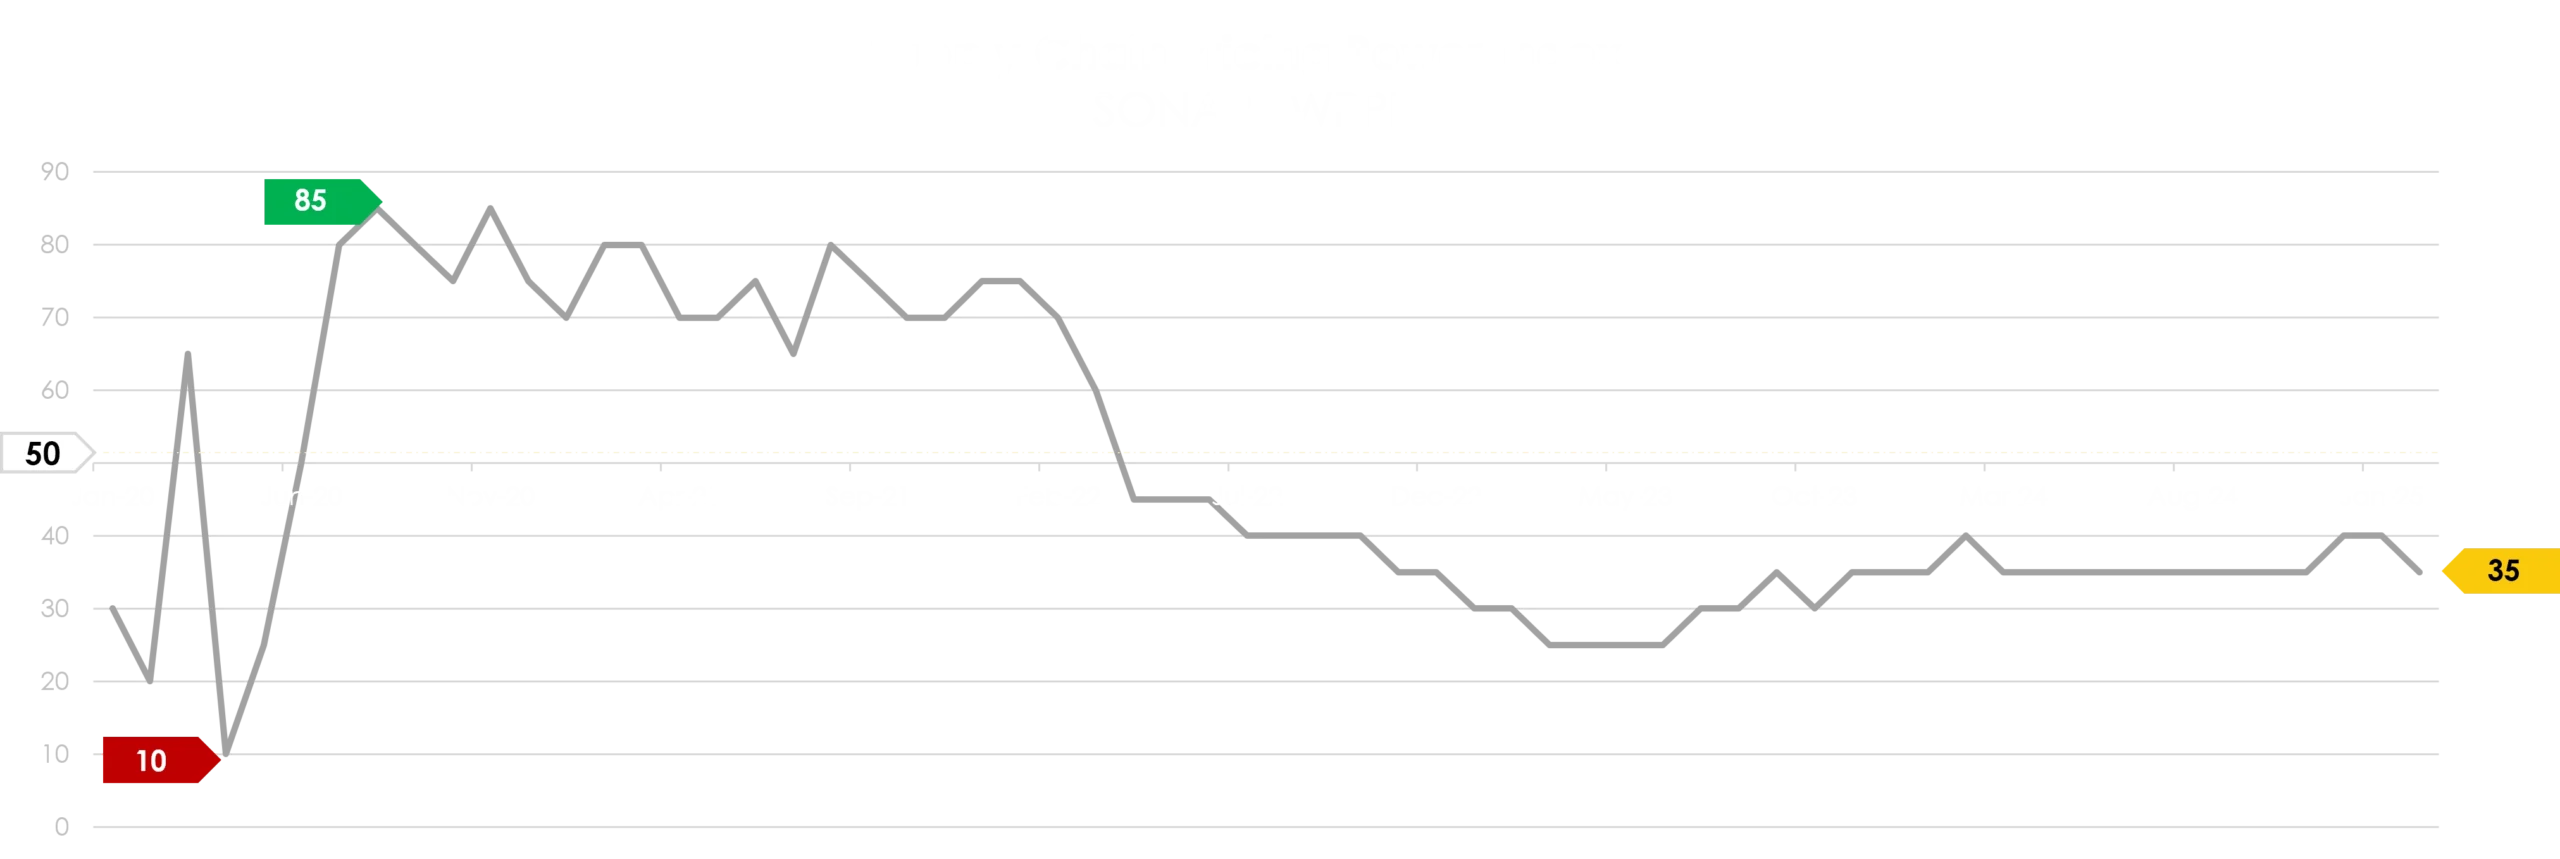
The SONAR Supply Chain Pricing Power Index shows which party holds the power in pricing negotiations: shippers or carriers. Q1 2025 saw the index decrease from 40 down to 35, indicating that shippers’ bargaining power in contract negotiations increased. The environment remains a shipper’s market, with the index moving further from the equilibrium point of 50. Shippers should be able to lock in favorable rates with carriers and potentially renegotiate or adjust as the direction of rates becomes clearer from leading economic indicators.

Source: FreightWaves SONAR – April 9, 2025
TRAFFIX FORECASTS:
7 LEADING INDICATORS TO WATCH IN Q2
- US and international retaliatory tariffs and trade policy
- US GDP (signals of potential recession)
- Inflation
- Diesel prices (oil price fluctuations)
- Consumer spending
- Global geopolitical tensions
- Manufacturing activity (PMI)

TRAFFIX FORECASTS:
TRUCK RATE VOLATILITY WILL CONTINUE WITH
REGIONAL JUMPS +/- 10%, AVERAGES NEAR 2024 LEVELS
- Tariffs will play a key role in freight demand, which will determine whether rates increase or decrease
- Carriers began entering the market in Q1 and equilibrium was reached between freight demand and capacity
- Economic indicators pre-tariffs are mixed, with manufacturing bouncing between expansion and contraction in Q1
- Freight pricing power remains with shippers, who can leverage their position to build value-added solutions
- While predictions are challenging with rapidly changing policy conditions, TRAFFIX forecasts that rates will hold at averages similar to 2024
- Expect market-specific transient jumps of +/- 10% or more
- This baseline forecast is subject to change based on market disruptions and evolving trends in freight demand and supply
RECCOMENDATIONS

Prepare for the Unexpected:
The roller coaster of policy changes is likely to continue throughout 2025, so be prepared to pivot when possible. Expanding contingency plans across supply chain, customer, and supplier networks could prove highly beneficial. Ensure all parts of those plans are lined up, including freight needs.

Examine Freight Strategies:
Protect against higher variability by partnering with reliable freight providers. Ensure backup providers can handle freight when market conditions spike, especially regionally. Confirm that Produce and Construction season impacts are accounted for in contract pricing.

Map Alternatives:
Partner externally and internally on supply chain mapping exercises to determine options available in the mid- and long-term. Build the business case and conditions necessary for supply chain shifts.
SUBSCRIBE TO TRAFFIX’
MARKET INSIGHTS
"*" indicates required fields


